


15 min read

Hi, I’m Vadim.
Healthtech venture is hard, a fact I’ve learned firsthand as an operator, accelerator director, and investor. I’ve watched too many good teams repeat avoidable mistakes others have already paid for. I write Healing Healthtech to distill research and the experiences of top-tier operators into actionable tactics and frameworks, so we can all aim to make only new mistakes.
Subscribe for a twice-monthly dispatch of free and paid field guides meant to help you build more deliberately toward something better in human health. And if it’s useful, please forward it to other healthtech builders in your network.
TLDR
Coach your funnel to two bars: one in three from qualified lead to conversation, one in five from conversation to wired check.
The conversation bar sits at the corpus median; clearing both is where you stop tinkering and add volume.
Read Carta and AngelList for how rounds end; read founder narratives for how raises run.
Cap tables record price, dilution, and instrument. Names contacted, per-step conversion, and wire slippage never reach them.
Plan one qualified investor name per $5-10K of target round.
Cold lists convert at 3-4% contact-to-check; a $750K round wants 80-120 names, not 30.
Budget the calendar for the build and the wire tail; the active raise is the short middle.
Both DocSend’s survey and the corpus put roughly three raises in ten past six months.
Respect the direct-check ceiling of 10-40 yeses per round; go wider only through a pooled vehicle.
Syndicates, RUVs, and crowdfunding are the only rounds in the corpus that broke it.
Track committed and wired as separate columns from the first yes.
The founders who measured slippage counted only wires; verbal commitments evaporated without ever being reported as no’s.
Author’s note
This piece is the data companion to Raising Angel and Preseed Funding for Digital Health [2]. The dataset ships with it: the comparison grid, the per-source verification ledger, and a primary-source link for every account.
This piece was built in Claude Cowork with a custom skill stack that I developed. Claude was my primary collaborator; Gemini, ChatGPT, and Perplexity served as red-team research associates. My use of generative AI is loud and proud, and in this piece it is also the method: Claude agents swept the open web for founder accounts and tabulated them, and every number they extracted was verified against its primary source before it entered the grid. The thesis and the judgment calls are mine.
Contents
The numbers that trace back to nobody.
Stop planning your raise on funnel folklore.
What Carta and AngelList see, and what they can’t.
Match each dataset to the decision it can support.
How the dataset was built.
Judge the verification standard before trusting any figure, mine included.
What the data shows.
Calibrate your funnel, calendar, check count, and clock against measured raises.
What founders should do with it.
Run five decision rules in your CRM from the first outreach.
What investors should take from it.
Read process discipline as a diligence signal; pace angel rounds on angel math.
Contribute your raise.
Add your account to the corpus, or correct your row.
1. The numbers that trace back to nobody
[001]When Jon Lee was raising Pickle’s pre-seed, I read his funnel every week, the way I read every founder’s I coach: qualified leads into conversations, conversations into checks. The week the two rates turned healthy, I told him to stop worrying about the raise, stop tinkering with the pitch and the targeting, and put 20-30 new investors into the top of the funnel every week; the round would close in three months. It closed three months later, almost to the day, and Jon came into my office bewildered at the precision of the forecast. No magic was involved. Healthy conversion against known weekly volume is arithmetic.
[002]The arithmetic came from a vantage almost nobody gets. For fifteen years my venture partner and I led the Future Labs at NYU, where we supported 300+ teams to $2.7B in capital raised and 44 exits. Watching that many raises run side by side is what taught me what healthy conversion looks like, when to stop tinkering with a venture’s design, pitch, and investor targeting, and how to forecast a close. The discipline works at cohort scale: 80% of my final cohort at Catalyst, NYU Tandon’s public-facing pre-seed-to-seed accelerator, closed a round within three months of graduation, and conversion-driven coaching is how we achieved that. 99% of founders will never sit inside a network like that, and the public record is no substitute: the conversion figures circulating in accelerator curricula and fundraising posts trace back to nobody (the deck cites a talk that cites a post that cites nothing), and no measured aggregate of per-step angel-round conversion had ever been published. I built this dataset to put the thing the Future Labs dataflow gave me into anyone’s hands, with sources attached.
[003]The gap it fills is concrete. How many investor names does a $750K round need? How many weeks will the raise take, and which weeks do what? What does a healthy funnel convert at each step, and when does a quiet one mean the pitch is broken rather than early? The advisory tradition answers with first-person judgment. Alex Iskold, Paul Graham, Charlie O’Donnell, Elizabeth Yin, and Mark Suster have shared theirs generously for years, and it is woven through the parent guide [2]. But judgment can’t be audited, and when two advisors disagree, the founder has no way to adjudicate.
[004]The Founder Narratives dataset is fifty verified first-person accounts of angel and pre-seed raises, published between 2008 and 2025, each reduced to the same operating row. Across the fifty, founders worked roughly 4,500 investor names, held some 2,000 first conversations, closed several hundred checks, and banked more than $150M across three continents [1].
![Figure 1. Active weeks against dollars raised; bubble area is names contacted. Source: HH Founder Narratives [1].](https://substackcdn.com/image/fetch/$s_!M1s6!,f_auto,q_auto:good,fl_progressive:steep/https%3A%2F%2Fsubstack-post-media.s3.amazonaws.com%2Fpublic%2Fimages%2F8489a873-ec98-4a1f-ac1b-bbdf04155d22_1824x1584.png "Figure 1. Active weeks against dollars raised; bubble area is names contacted. Source: HH Founder Narratives [1].")
Figure 1. Active weeks against dollars raised; bubble area is names contacted. Source: HH Founder Narratives [1].
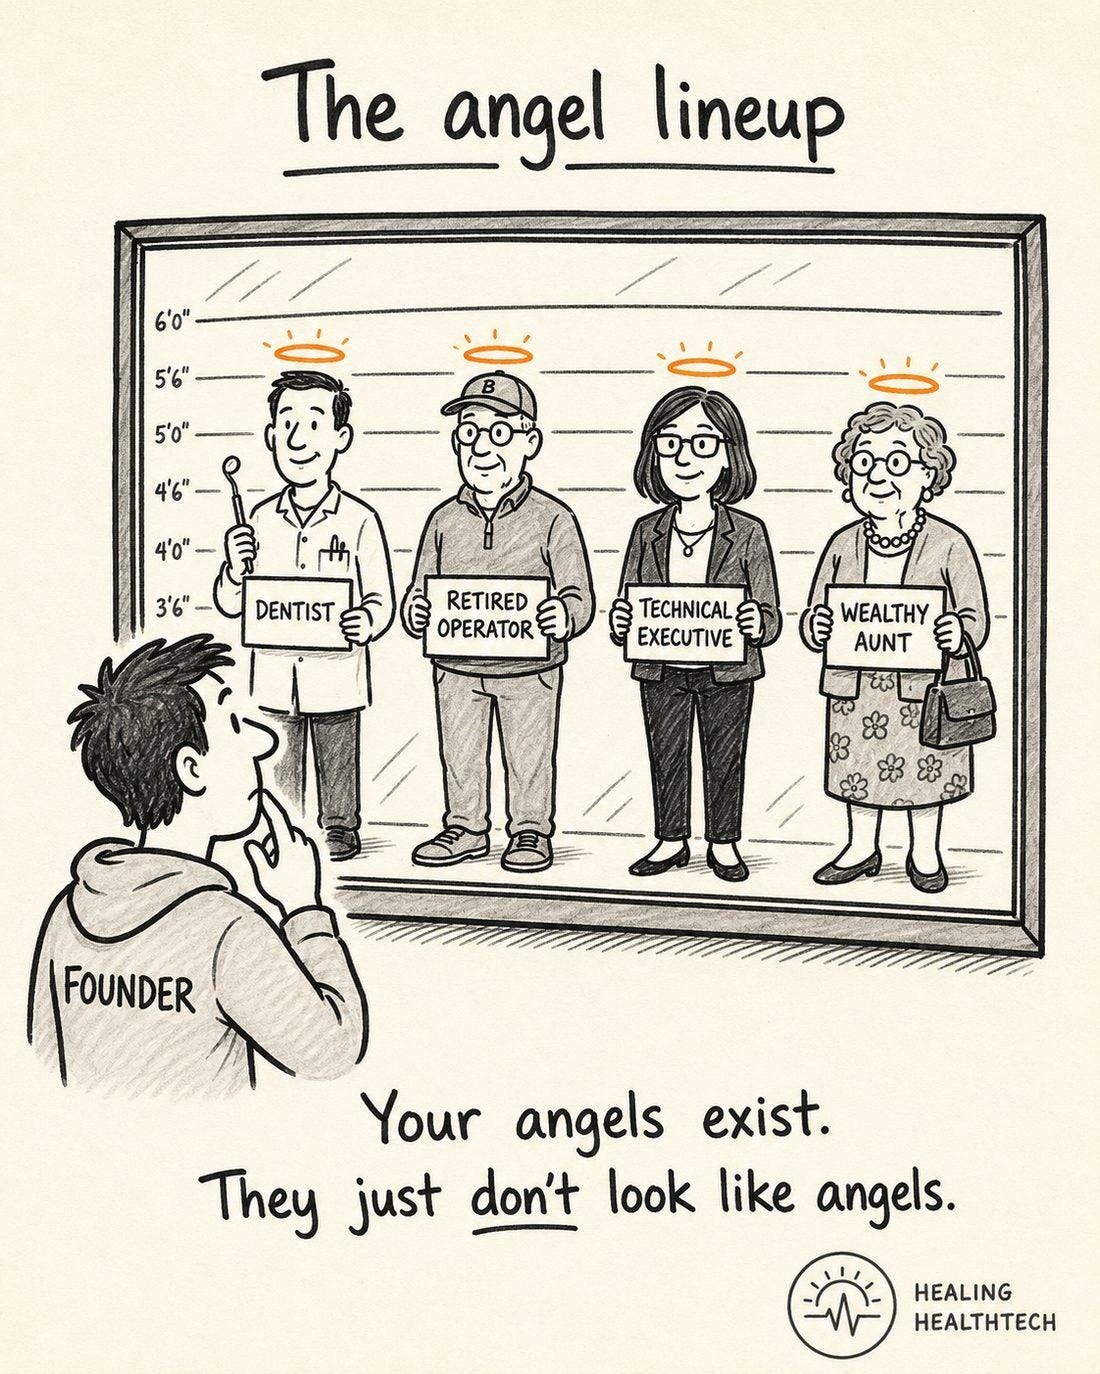
If you read Part II, you have seen this chart; it opens the process guide as a promise and a warning. Every bubble is a real raise from a named founder, and no existing dataset could have produced it. The promise comes first: angel rounds close at every size, on both clocks, and on three continents. The supply side backs the promise up. The US alone counted 422,000 active angels in 2023, funding 55,000 ventures with $18.6B; Europe’s formal networks add 45,000 more, and that census misses the informal majority [8]. Roughly 500,000 angels will write checks into some 60,000 companies around the world this year. Your angels exist. What separates the founders who find them is process, and process is learnable.
2. What Carta and AngelList see, and what they can’t
Carta operates the largest cap-table dataset in the industry, roughly 500,000 signed SAFEs and notes since 2018 and more than 10,000 seed rounds from 2021 through late 2025, and Peter Walker has spent years cutting it against most of the consequential questions a founder faces: round sizes, valuations, dilution by instrument, cofounder splits, founder salaries, time between rounds [3]. AngelList’s deal flow has given its data science team, Abe Othman’s work in particular, a comparable vantage over the syndicate market [4]. DocSend’s index adds deck behavior: read time by intro type, slide order, survey-recalled fundraising duration [5]. Parts I and II lean on all three.
Each instrument records an ending. A cap table is a record of how a raise finished: who owns what, at what price, on which instrument. Platform deal flow records the transactions that reached the platform. Deck telemetry records what happened after the deck arrived. None of them can see how the raise ran: how many names the founder contacted, what fraction became conversations, how long she calibrated before opening the round, how many verbal yeses never wired. Those numbers live in the founder’s CRM, or in her head, and they never touch the systems the industry aggregates. No platform’s data exhaust contains them, so no platform could have published them.
A selection problem sits on top of the measurement problem. Cap-table and platform data are conditioned on completion: a round appears in Carta because it closed, and on AngelList because it transacted there. The raise that stalled at week ten and the funnel that leaked at the conversation step leave no record at all. The Narratives corpus carries its own selection bias, which section 3 takes seriously; the point is that the two biases run in different directions, and a founder planning a process needs the process-level view even when it is noisier.
The missing data was sitting in public the whole time. Founders have been writing detailed post-mortems of their raises for fifteen years, on Medium, Substack, LinkedIn, and company blogs, some with complete funnel tables: Niels Hoven published the anatomy of Mentava’s 50-angel round, Obum Egbuna the 300-name outreach behind Chezie’s $780K, Williams the 99-contact, 36-check funnel behind Urban Jungle’s £1M [1]. Each was read as a story and cited as an anecdote. Fifty of them, held to one schema and verified against their sources, become a dataset. That aggregation is the entire contribution.
3. How the dataset was built
Claude agents swept Substack, Medium, LinkedIn, and the open web for first-person accounts of angel and pre-seed raises, with three admission criteria: a named founder, a first-person telling, and specific process numbers rather than a victory lap. Each candidate account was fetched in full and its figures checked against the primary source. Accounts that couldn’t be fetched (login walls, deleted posts, audio-only) were held as pending and excluded from every aggregate. A per-source verification ledger records what was checked, when, and to what standard [1].
From every account we extracted the same operating row: names contacted, first conversations, checks closed, and the conversion at each step; calibration time versus active raise time; check sizes and dollars raised per name; the instrument and cap-table container; what the anchor check changed; and whether committed money failed to wire. Blanks are data: where an account doesn’t report a field, the cell stays empty and nothing is imputed. Derived values (currency conversions, midpoints, floors under “50+” claims) are flagged as derived, with the basis recorded in the grid.
Where the public record ran out, I reached out to the founders directly on LinkedIn, and many happily responded, filling in data points missing from every published account. Williams confirmed that his 36 closed checks exclude two or three verbal yeses that never signed or wired, which he quietly reclassified as no’s; published yes-counts likely absorb their dropouts the same way. Egbuna confirmed zero commit-to-wire slippage on Chezie’s RUV round. Three of the six fully documented funnels in Part II are founder-confirmed by direct correspondence [1].
Fifty self-published accounts are a self-selected sample: founders who closed, and who chose to write about it, skew more transparent and more successful than the population. Market regimes aren’t comparable; a 2021 yes-rate and a 2023 yes-rate describe different worlds. UK tax relief inflates British angel yes-rates against American ones. And accounts define “contacted” differently (emailed, listed, met), so the grid tracks each account’s denominator and refuses cross-denominator averages. The corpus argues from named raises and recurring clusters, and holds its aggregates more loosely than one would hold Carta-grade data. The claim standard is pattern recurrence: when the same structure appears across founders who never read each other, it is worth planning around.
4. What the data shows
A healthy funnel is one in three, then one in five.
The corpus’s central numbers: a healthy angel raise converts about one in three qualified leads into a real conversation, and about one in five conversations into a wired check. Compounded, roughly one qualified lead in fifteen becomes a check. The two fully documented under-networked funnels ran below that bar, at 3-4% lead-to-check on cold lists, and still closed; the lean funnel bought a longer raise. Warmth moves every number. Own-network founders ran 14-36% lead-to-check, and the relationship-rich skipped the funnel entirely: the shortest raise in the corpus closed $555K on a single ask, twenty-one days, no deck, seventeen years of earned trust [1].
![Figure 2. Per-step conversion for six fully documented funnels. The drawn ~1 in 3 bar applies to the contact-to-meeting step; the conversation-to-check bar is ~1 in 5 (Figure 3). Source: HH Founder Narratives [1].](https://substackcdn.com/image/fetch/$s_!VonJ!,f_auto,q_auto:good,fl_progressive:steep/https%3A%2F%2Fsubstack-post-media.s3.amazonaws.com%2Fpublic%2Fimages%2F75d0191f-1186-47a1-acb6-4f9bc41fdd61_1824x1584.png "Figure 2. Per-step conversion for six fully documented funnels. The drawn ~1 in 3 bar applies to the contact-to-meeting step; the conversation-to-check bar is ~1 in 5 (Figure 3). Source: HH Founder Narratives [1].")
Figure 2. Per-step conversion for six fully documented funnels. The drawn ~1 in 3 bar applies to the contact-to-meeting step; the conversation-to-check bar is ~1 in 5 (Figure 3). Source: HH Founder Narratives [1].
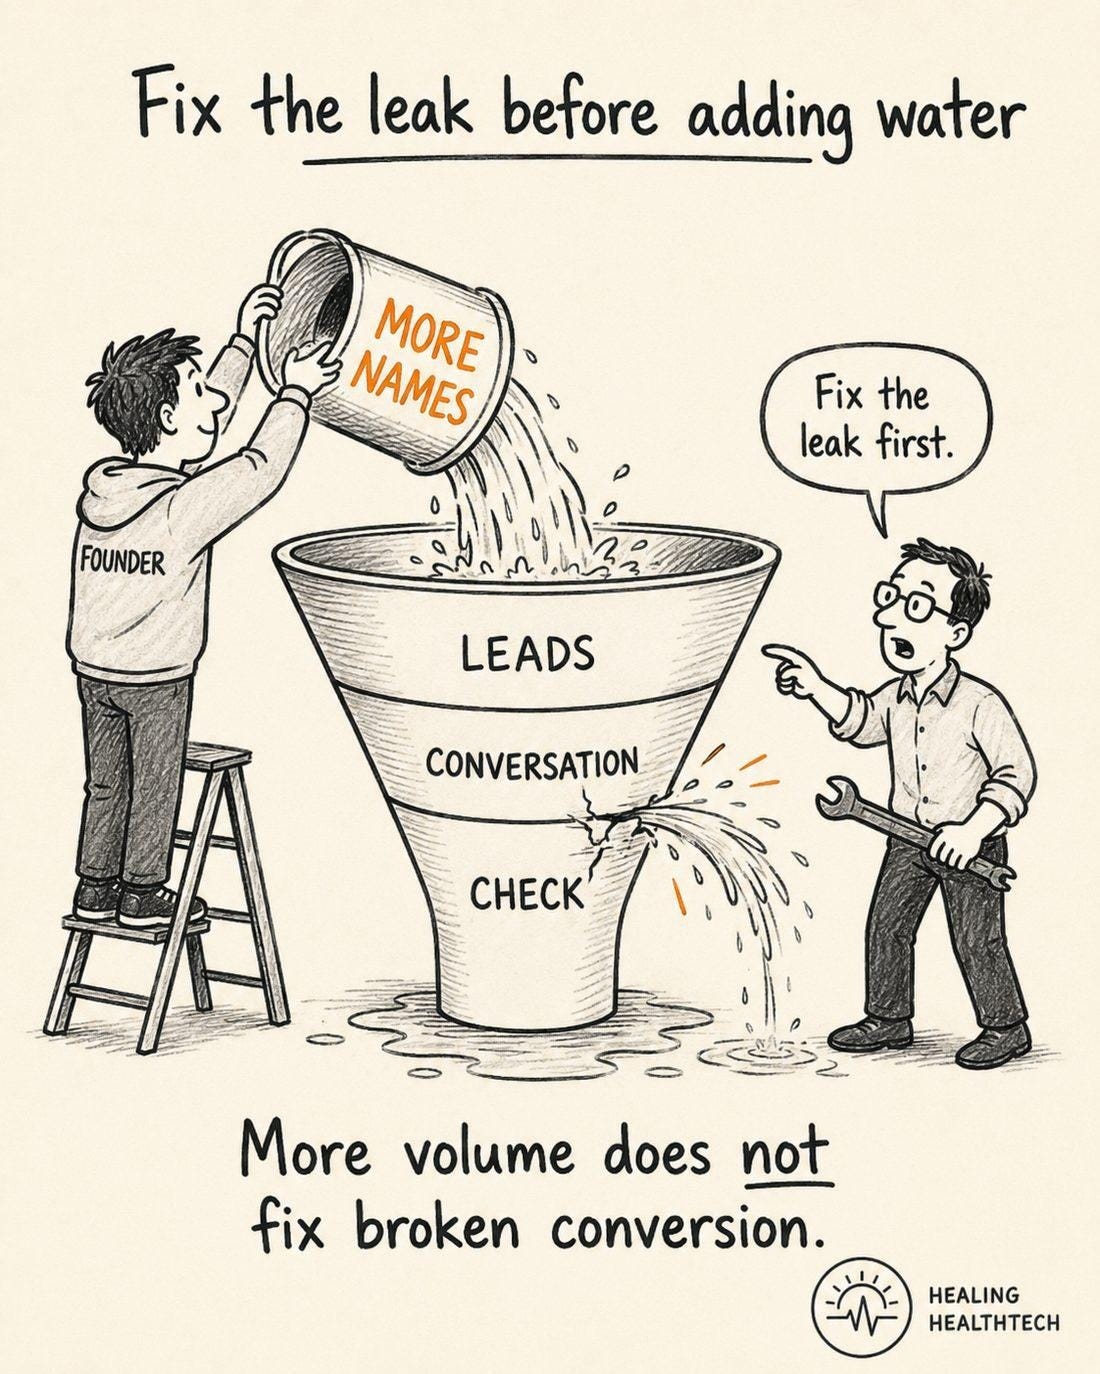
The location of the leak names the problem. Leads that never become conversations are a targeting or story problem: you aren’t earning the meeting. Conversations that never become checks are a proof, anchor, or close-date problem: you aren’t closing it. The two send you to different fixes, and adding leads multiplies the conversion you already have. The rates are not readable until you have pitched about twenty check-writing strangers; friendly meetings and practice pitches do not count, and a thinner sample is tuition rather than a verdict. Expect roughly half the healthy rates until the first meaningful check lands; account after account shows the anchor changing the psychology of every meeting that follows [1].
Be precise about what each bar asks. Across the ten documented funnels, the median conversation-to-check is about one in five: two checks from ten real conversations is the middle of the corpus, with warm and inbound raises above one in two and cold institutional funnels below one in ten. The conversation-to-check coaching bar sits at that median. The top step runs higher; documented funnels cluster around one in three lead-to-conversation, and that is the bar there. A funnel clearing both is healthy: stop tinkering with the pitch and the targeting, feed the funnel on a weekly schedule, and let the arithmetic run.
![Figure 3. Conversation-to-check for the ten documented funnels, with 95% intervals; the coaching bar sits at the corpus median. Source: HH Founder Narratives [1].](https://substackcdn.com/image/fetch/$s_!xEf7!,f_auto,q_auto:good,fl_progressive:steep/https%3A%2F%2Fsubstack-post-media.s3.amazonaws.com%2Fpublic%2Fimages%2F7be5cc96-4d53-44c6-9f40-26cfbeafd712_1823x1509.png "Figure 3. Conversation-to-check for the ten documented funnels, with 95% intervals; the coaching bar sits at the corpus median. Source: HH Founder Narratives [1].")
Figure 3. Conversation-to-check for the ten documented funnels, with 95% intervals; the coaching bar sits at the corpus median. Source: HH Founder Narratives [1].
Table 1. Median 22%; the 30% mean is pulled up by the warm and inbound rows. Per-row caveats (institutional-only counts, inbound funnels, denominator definitions) are in the chart data tabs [1].
The active raise is the short middle
Ask a founder how long a raise took and you get one number; decompose the reported timelines and you get three. The build (sharpening the pitch, assembling the list, accumulating proof) and the wire tail (collecting money already committed) surround a short active window. Hoven spent four months iterating Mentava’s pitch, four weeks raising full-time, and roughly three more chasing wires from an oversubscribed round [1]. The pattern holds down the chart: the part that looks like fundraising is the shortest part, and the calendar mistake founders make is budgeting for the middle while the build and the tail spend the runway.
![Figure 4. Build, active raise, and wire tail, in reported order. Source: HH Founder Narratives [1].](https://substackcdn.com/image/fetch/$s_!49i3!,f_auto,q_auto:good,fl_progressive:steep/https%3A%2F%2Fsubstack-post-media.s3.amazonaws.com%2Fpublic%2Fimages%2F5c997c59-195f-4a77-aa51-902fb375b150_1824x1584.png "Figure 4. Build, active raise, and wire tail, in reported order. Source: HH Founder Narratives [1].")
Figure 4. Build, active raise, and wire tail, in reported order. Source: HH Founder Narratives [1].
On total duration, DocSend’s seed survey and the corpus agree where it matters: roughly three raises in ten run past six months, so the marathon is a third of the market rather than a failure case [5][1]. They disagree at the short end (35% of corpus raises ran six active weeks or fewer, against 15% in DocSend’s recall) because they measure different quantities: DocSend records survey-recalled total fundraising time, the Narratives measure documented active raise time. Plan your calendar on the decomposition, not on a single recalled number.
![Figure 5. Survey recall versus documented founder accounts. Sources: DocSend seed survey [5]; HH Founder Narratives, n = 26 [1].](https://substackcdn.com/image/fetch/$s_!Pf8k!,f_auto,q_auto:good,fl_progressive:steep/https%3A%2F%2Fsubstack-post-media.s3.amazonaws.com%2Fpublic%2Fimages%2F48d4d74b-4a68-4cdf-8cec-e8c96a98d08a_1824x1584.png "Figure 5. Survey recall versus documented founder accounts. Sources: DocSend seed survey [5]; HH Founder Narratives, n = 26 [1].")
Figure 5. Survey recall versus documented founder accounts. Sources: DocSend seed survey [5]; HH Founder Narratives, n = 26 [1].
Direct checks have a ceiling
Plot average check size against round size and the direct-check rounds cluster between the 10-check and 40-check diagonals: rounds built from individually signed checks top out at roughly 10-40 yeses, because every signature is a relationship, a paperwork packet, and a cap-table line. The rounds that broke the ceiling pooled their long tail into a container: a syndicate, an RUV, or crowdfunding. Egbuna’s RUV took checks from $1,000 by debit card and landed fifty investors on one cap-table line [1]. Part II’s $10K floor on direct checks falls straight out of this chart: below the floor, take the believer’s money through a container or not at all.
![Figure 6. Average check versus round size, log-log; dashed diagonals mark a constant number of checks. Source: HH Founder Narratives, n = 17 verified raises [1].](https://substackcdn.com/image/fetch/$s_!0Rnc!,f_auto,q_auto:good,fl_progressive:steep/https%3A%2F%2Fsubstack-post-media.s3.amazonaws.com%2Fpublic%2Fimages%2F58ccc2e7-f77b-48c5-a4db-eb87aa9c88ff_1824x1584.png "Figure 6. Average check versus round size, log-log; dashed diagonals mark a constant number of checks. Source: HH Founder Narratives, n = 17 verified raises [1].")
Figure 6. Average check versus round size, log-log; dashed diagonals mark a constant number of checks. Source: HH Founder Narratives, n = 17 verified raises [1].
The clock is a demand reading
The corpus documents two pacing patterns and almost nothing between them. The sprint piles up intros during a calibration period, then lands every meeting in one dense window with a close date every investor can see. The marathon keeps the round open while proof accrues, with a deadline set investor by investor. The meetings in the two diagrams below are identical; the only thing that changes is when they happen, and that timing is the entire difference in leverage [9].
![Figure 7. The Sprint: conversations accumulate early; decisions land together. Concept after Daniel Olmedo’s meeting-density diagram [9].](https://substackcdn.com/image/fetch/$s_!OAY8!,f_auto,q_auto:good,fl_progressive:steep/https%3A%2F%2Fsubstack-post-media.s3.amazonaws.com%2Fpublic%2Fimages%2F26c94d70-0351-4948-923d-1a171aa17e99_1824x1280.png "Figure 7. The Sprint: conversations accumulate early; decisions land together. Concept after Daniel Olmedo’s meeting-density diagram [9].")
Figure 7. The Sprint: conversations accumulate early; decisions land together. Concept after Daniel Olmedo’s meeting-density diagram [9].
![Figure 8. The Marathon: each conversation starts before the last one resolves, on the same 12-week skeleton. Concept after Daniel Olmedo’s meeting-density diagram [9].](https://substackcdn.com/image/fetch/$s_!e7KW!,f_auto,q_auto:good,fl_progressive:steep/https%3A%2F%2Fsubstack-post-media.s3.amazonaws.com%2Fpublic%2Fimages%2Fedfe682b-c87d-4d39-affa-31eb113f38ff_1824x1280.png "Figure 8. The Marathon: each conversation starts before the last one resolves, on the same 12-week skeleton. Concept after Daniel Olmedo’s meeting-density diagram [9].")
Figure 8. The Marathon: each conversation starts before the last one resolves, on the same 12-week skeleton. Concept after Daniel Olmedo’s meeting-density diagram [9].
In the corpus, sprints closed materially larger rounds than marathons, and the causal arrow points backward: founders don’t raise more because they sprint, they get to sprint because demand is strong [1]. That makes the clock a reading the market takes of you, and one you re-check as the raise runs. A planned sprint still raising at week ten is the market answering the demand question; the response is to resize the round, reset each investor’s deadline, and re-declare the mode as a decision, because a sprint that decays into an undeclared marathon reads, from the investor’s side, like a deal that has been shopping for months.
Committed money fails to wire at a measurable rate: Riesen’s pipeline carried four investors in the closed stage who never wired, and Williams filed his two or three silent yeses as no’s [1]. The founders who could report their slippage precisely were the ones who had tracked committed and wired as separate columns. The gap between those columns is a real funnel stage with its own loss rate, and no published yes-count includes it.
5. What founders should do with it
Five decision rules, runnable in a CRM from the first outreach.
Size the list to the round: one qualified name per $5-10K of target. A $750K round wants 80-120 named angels, operator-angels, and micro-VCs that write at angel sizes. At healthy conversion, every check sits on ten qualified names; on a cold list, contact-to-check runs 3-4%, so 30 names is a rehearsal, not a fundraise [1].
Instrument two conversion columns from day one. Lead-to-conversation and conversation-to-check, read against the bars (one in three, one in five) once about twenty check-writing strangers have heard the pitch. Fix the leaking stage before adding volume; a bigger list multiplies the conversion you already have. Once both steps clear the bar, stop tinkering and feed the funnel on a weekly schedule; healthy conversion against known volume is a close date you can put on a calendar.
Pick your clock in writing, and re-read it at week ten. Sprint or marathon, declared, with every conversation carrying its own deadline. The marathon is a legitimate third of the market; the undeclared marathon is a shopped deal.
Set a $10K floor on direct checks, and stand up a container below it. The 10-40-yes ceiling is structural. An RUV or syndicate turns the long tail of small believers into one cap-table line instead of thirty signature chases [1].
Collect every yes the day it lands, and track committed versus wired. A SAFE binds one investor at a time; nothing rewards waiting, and the corpus’s slippage data says a verbal yes is a pipeline stage, not money [1].
The founders who struggle most with this, in my coaching, have been the clinicians, engineers, and scientists coming to venture for the first time; the open-endedness of a raise sits badly with people whose day jobs run on protocols and proofs. They are also the founders best built for it. Each of those professions trains its people to make informed decisions with limited knowledge: a treatment plan from an incomplete picture, a design margin against loads nobody can fully model, an experiment that pays for itself in information either way. Conversion-driven fundraising is the same discipline pointed at capital: instrument the funnel, read it once twenty strangers have heard the pitch, act on the leak it names. That reframe is what has gotten my most uncertainty-averse founders over the hump for years, and sharing it beyond the founders I can coach in person is half of why this dataset exists.
None of this is fundraising exotica. A named list, weekly stage transitions, conversion read at each step, leaks fixed rather than worked around: this is the same discipline your company will need for sales, partnerships, and hiring. The raise is a trial run for the business-development function, and the corpus founders who closed on the timeline they planned ran it that way [1].
6. What investors should take from it
The same numbers read differently from the other side of the table.
Process discipline is a diligence signal. A founder who can tell you her two step rates, her denominator definition, and where the funnel is leaking is showing you the sales motion her company will run after the round. The corpus founders who closed on plan all kept named lists and weekly reviews; the improvisers drifted past the runway they intended [1].
Pace angel rounds on angel math. An angel round needs fifteen to forty separate yeses; an institutional raise ends at one or two term sheets. Judging an angel raise’s week-eight state against fund-raise pacing misreads it, in either direction. The comparator funnels (Right Side Capital’s institutional model, the Gompers 100-to-1 VC funnel) describe a different process; Part II works both [2][6].
Your pass is data the founder can use. The angels who engaged seriously and passed hold the most useful read on a round, precisely because they have no position. When a founder asks for ten minutes to understand where the process is losing people, take the call; the corpus says the disciplined ones act on it [1][2].
Pooled vehicles moved the floor. A $1,000 debit-card check through an RUV is now ordinary infrastructure. Expect more rounds shaped as a handful of direct anchor checks plus a pooled tail, and price the cap-table cleanliness accordingly [1].
Mind what the corpus can’t say. It is conditioned on closing: it shows what closing looked like, not the odds of closing. The base rates sit elsewhere: healthcare-focused VCs fund roughly 1% of what they see, and angel groups fund 3-5% of applications [6][7].
7. Contribute your raise
Fifty accounts is a start. Sixty thousand companies will close an angel round this year [8], and the process data behind those raises should not have to be folklore. If you have raised an angel or pre-seed round and written a first-person account with numbers in it, or are willing to write one, send it to me and I’ll add it to the grid with full credit and a primary-source link. And if your raise is already a row and I have something wrong, tell me: every figure carries its source, and corrections are cheaper than myths. The strategy this data underpins lives in Parts I and II.
References
Vadim Gordin, HH Founder Narratives dataset: 50 verified first-person founder accounts of angel and pre-seed raises (2008-2025), comparison grid, chart data tabs with confidence intervals, and per-source verification ledger. Ships with this piece; every founder cited above (Hoven, Egbuna, Williams, Riesen, Zuo, Chalmer, Gillenwater, Olmedo) is keyed to a primary-source link in the grid.
Vadim Gordin, Venture Funding for Fun and Profit: “Part I, The Narrative” (https://healinghealthtech.substack.com/p/raising-angel-and-preseed-funding) and “Part II, The Process” (https://healinghealthtech.substack.com/p/raising-angel-and-pre-seed-funding), Healing Healthtech, June 15, 2026. The guide this dataset was built for.
Carta, State of Pre-Seed and State of Private Markets series; Peter Walker, Head of Insights. Cap-table data: ~500,000 signed SAFEs and notes since 2018; 10,000+ seed rounds 2021-Q3 2025. https://carta.com/data/
AngelList data science analyses of platform deal flow (Abe Othman). Referenced as context for what platform datasets cover; no figures in this piece are drawn from AngelList data.
DocSend Startup Index (Dropbox). Deck read-time by intro type and survey-recalled fundraising duration. https://www.docsend.com/index/
Paul Gompers, William Gornall, Steven N. Kaplan, and Ilya A. Strebulaev, “How Do Venture Capitalists Make Decisions?” Journal of Financial Economics 135(1), 2020. Median VC funnel ~100 opportunities considered per investment closed; ~78 in the healthcare subsample.
Angel Capital Association, “Trends in Funding Rates,” Dealum platform data, 2022-2024. Application-to-funded: pre-seed 3.0%, seed 4.5%.
Center for Venture Research (Jeffrey Sohl), The Angel Market in 2023, University of New Hampshire, 2024 (422,350 active US angels; 54,735 ventures; $18.6B); EBAN Statistics Compendium 2023. The rounded global claim is conservative.
Daniel Olmedo, “Funding Rounds’ Cheat Sheet 2026,” Fundraising Journey (Substack), Dec 2025. Meeting density as the lever that converts volume into leverage; the sprint and marathon diagrams follow his meeting-density concept.